
Canada's Housing Recovery Is Coming — But Don't Expect a BoomWhat RBC's Latest Forecast Means for Buyers and Sellers in 2026-2027If you've been waiting for a sign that the Canadian housing

Dated: February 18 2026
Views: 199
📊 In January 2026, GTA home sales fell 19.3% year-over-year and average prices declined 6.5% (TRREB). Overpricing today is costlier than ever.
If you're asking "Is my home priced too high in Ontario?", you're already ahead of most sellers. In today's Southern Ontario market, overpricing does not fail loudly — it fails quietly. Showings slow. Online saves stay flat. Feedback sounds polite. Then four weeks pass and momentum is gone.
In early 2026, pricing accuracy matters more than ever. According to TRREB's January 2026 Market Watch, GTA sales were down year-over-year and benchmark prices softened compared to 2025. The Canada Mortgage and Housing Corporation (CMHC) signals a cautious recovery — not a price surge. Buyers in Toronto, Newmarket, Vaughan, Mississauga, Burlington, and across York, Peel and Halton are selective. They compare data. They use AI valuation tools. They track list-to-sale ratios.
If your home is priced even 3–5% above perceived market value, buyers will scroll past without saying a word.
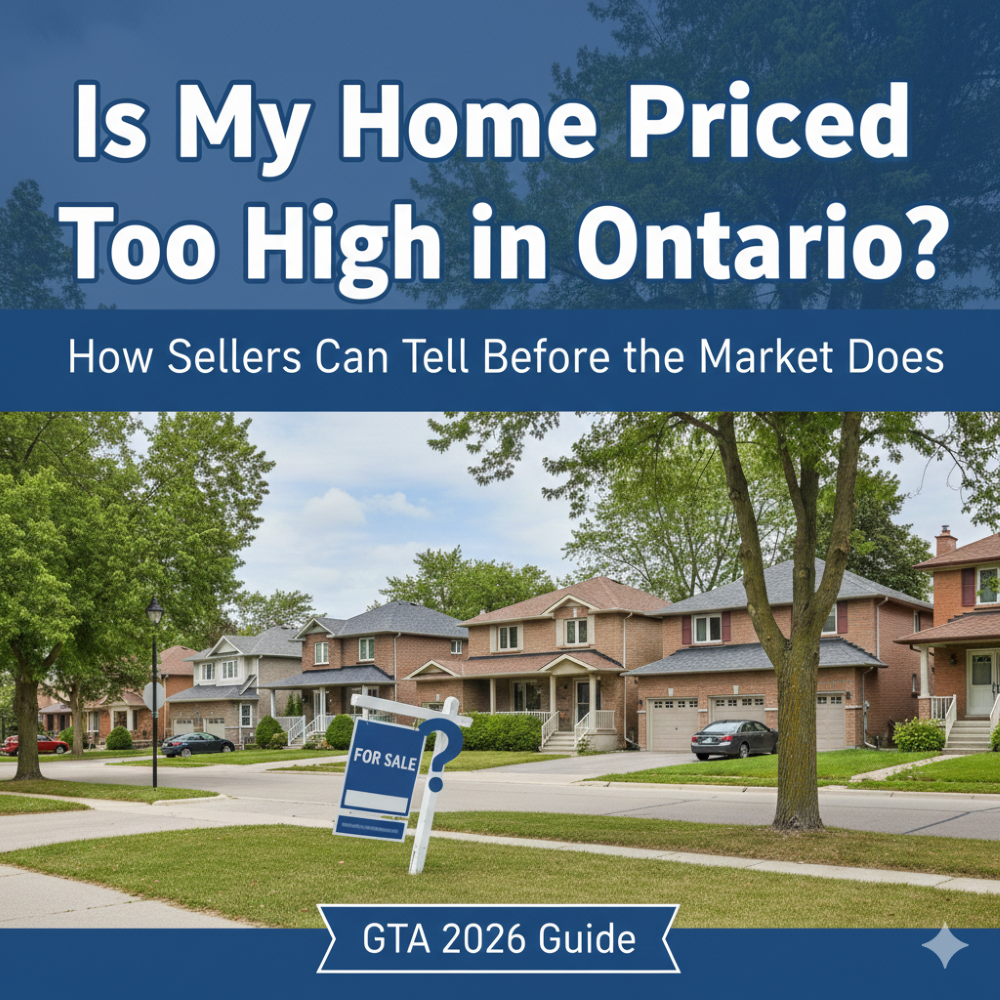
GTA recorded 3,082 home sales in January 2026 — down 19.3% year-over-year. The average selling price fell 6.5% to $973,289. The MLS Home Price Index composite benchmark dropped 8% versus January 2025.
After a cooling phase in 2025, Ontario's housing market is moving through a cautious recovery where buyers remain price-sensitive and data-driven. CMHC's Housing Market Outlook notes prices declined in 2025 and are expected to show only modest gains — well below long-term sales averages. This means "test the market" pricing is far riskier than it was during the pandemic boom.
For homeowners in Toronto, Newmarket, Vaughan, Mississauga, and Burlington, you must align asking prices closely with recent sold data and buyer affordability realities — not past peak values from 2021–2022.
| Region | Market Behavior (Early 2026) | Pricing Sensitivity |
|---|---|---|
| Toronto | High inventory pockets in condos | Very price-sensitive |
| York Region (Newmarket, Vaughan) | Balanced detached market | Moderate sensitivity |
| Peel (Mississauga, Brampton) | Competitive entry-level demand | Strong under $1M |
| Halton (Burlington, Oakville) | Selective luxury demand | Highly price-aware |
| Durham | Value-driven buyers | Quick rejection of overpricing |
| Waterloo | Tech-driven demand stabilizing | Data-focused buyers |
Well-priced homes attract activity in the first 7–10 days. If similar detached homes in Newmarket are getting 12–15 showings in week one and you're at 4, that's a pricing signal.
In a balanced market, serious buyers act within 2–3 weeks on a competitively priced property. No offers with strong marketing? Price is almost always the issue.
Consistent feedback that buyers feel your home is expensive vs. others in Vaughan or Mississauga is comparative analysis — not opinion. Buyers are using TRREB data and AI tools.
If similar homes are selling in 18 days and yours is at 32+ days, something is off — especially true when your condition and location are comparable.
Using 2021 peak values in a 2026 market is risky. Where average prices dropped 6.5% year-over-year, a price-to-value gap creates immediate buyer resistance.
Start with three to six comparable properties sold in your neighborhood within the last 60–90 days. Focus on same property type, square footage, age, condition, and micro-area. Use TRREB Market Watch and CREA housing stats to understand benchmark trends for your specific segment.
Look at what similar homes were originally listed for versus what they actually sold for. If comparable properties in Toronto are closing at 97–98% of list price, that gap is critical context for your pricing decision.
Months of inventory tells you who has leverage at the negotiating table:
1–2 months = Seller advantage | 3–4 months = Balanced | 5+ months = Buyer advantage. In balanced or higher-inventory conditions like early 2026, pricing precision matters far more.
CMHC and Bank of Canada data make clear that mortgage affordability shapes real price ceilings. A home priced on 2021–2022 peak expectations may now sit above what today's buyers can actually qualify for — even if the property itself is excellent.
Longer Days on Market. Extended DOM reduces urgency and triggers buyer suspicion. In a market where GTA sales volumes are already down 19.3%, anything that lingers starts to look like a problem listing — weakening your negotiating position even before an offer comes in.
Price Stigma. Multiple reductions signal desperation. A home listed at $1,099,000, reduced to $1,049,000, then $999,900 will often sell lower than if it had started correctly at $999,900 — because buyers expect further discounts at each revision.
Lost Momentum. The first 14 days on market — with fresh listing status and maximum portal visibility — are your most powerful window. If the price is out of step with current GTA or York Region data, you waste that window and must work harder (and cheaper) to recapture interest later.
Track showing volume vs. area averages, online view and save metrics, and the quality and consistency of buyer/agent feedback. Below-average traffic is early evidence — not bad luck.
Make a meaningful correction that moves you into a new search bracket. Example: $1,029,000 → $999,900. Pair with refreshed photos, updated listing remarks, and renewed marketing push.
Revisit full positioning: price, presentation, and promotion. In some cases, a temporary withdrawal and clean re-listing with a data-backed price resets the narrative — especially effective in York Region and Peel where buyers monitor DOM closely.
Review 60–90 day sold comparables in your micro-area, analyze the current list-to-sale ratio for your property type, and evaluate the market absorption rate in your segment. Use data from TRREB and CREA as your baseline.
In 2026, usually no. Data consistently shows that properly priced homes generate more engagement, stronger initial offers, and faster sales — the "test high" strategy typically results in longer DOM and a lower final sale price than accurate pricing from day one.
Today's buyers consult TRREB market reports, CREA housing statistics, AI-powered home valuation tools, and mortgage affordability calculators. They know current value bands and can identify outliers quickly — making overpricing immediately visible to your target audience.
They provide useful starting ranges based on recent sales and property attributes, but struggle with renovation quality, lot uniqueness, and micro-location nuance. A human Comparative Market Analysis (CMA) backed by live MLS data remains essential in markets as nuanced as Southern Ontario.
If after 2–3 weeks of strong marketing your showings are below area norms, you have no serious offers, and agent feedback consistently mentions price — adjust decisively rather than incrementally. Small token reductions rarely move the needle; meaningful bracket shifts do.
Pricing is not guesswork. It requires real-time Comparative Market Analysis, list-to-sale ratio evaluation, absorption rate review, and micro-neighborhood expertise. Deepak Raj positions homes where serious buyers are already searching — not where sellers hope they'll stretch.

Deepak Raj is a professional Real Estate Agent in Newmarket with Royal Canadian Realty, proudly serving home buyers, sellers, investors, and business owners across Newmarket, Aurora, Markham, Stouffvi....
Canada's Housing Recovery Is Coming — But Don't Expect a BoomWhat RBC's Latest Forecast Means for Buyers and Sellers in 2026-2027If you've been waiting for a sign that the Canadian housing
GTA & York Region Real Estate Market Update: August 2026What the latest TRREB numbers mean in Newmarket, Aurora, Markham, Vaughan, Simcoe County and across Southern OntarioBy Deepak Raj, Realtor
Newmarket Market Data · July 2026How Long Does It Really Take to Sell a House in Newmarket?2026 Market Data, Neighbourhood-Level Days on Market & What It Means for Your SaleQuick AnswerAs
Deepak Raj Realtor Royal Canadian Realty, BrokerageBook a Free ConsultationUnderstanding your Buyer Representation Agreement before you sign matters as much as the offer itself.Ontario Buyer's&

The listing data displayed is deemed reliable but is not guaranteed accurate by CREA®. Data last updated on September 22, 2026 11:33 PM UTC The trademarks REALTOR®, REALTORS®; and the REALTOR® logo are controlled by The Canadian Real Estate Association (CREA®) and identify real estate professionals who are members of CREA®. Used under license. The trademarks MLS®, Multiple Listing Service® and the associated logos are owned by The Canadian Real Estate Association (CREA®) and identify the quality of services provided by real estate professionals who are members of CREA®. Used under license.
Show More...
 Data provided by the Ontario Regional Technology & Information Systems. The information is deemed reliable, but is not guaranteed. Not intended to solicit buyers or sellers, landlords or tenants currently under contract.
The trademarks REALTOR®, REALTORS® and the REALTOR® logo are controlled by The Canadian Real Estate Association (CREA) and identify real estate professionals who are members of CREA. The trademarks MLS®, Multiple Listing Service® and the associated logos are owned
by CREA and identify the quality of services provided by real estate professionals who are members of CREA. Used under license.
REALTOR® contact information provided to facilitate inquiries from consumers interested in Real Estate services. Please do not contact the website owner with unsolicited commercial offers.
Show More...
Data provided by the Ontario Regional Technology & Information Systems. The information is deemed reliable, but is not guaranteed. Not intended to solicit buyers or sellers, landlords or tenants currently under contract.
The trademarks REALTOR®, REALTORS® and the REALTOR® logo are controlled by The Canadian Real Estate Association (CREA) and identify real estate professionals who are members of CREA. The trademarks MLS®, Multiple Listing Service® and the associated logos are owned
by CREA and identify the quality of services provided by real estate professionals who are members of CREA. Used under license.
REALTOR® contact information provided to facilitate inquiries from consumers interested in Real Estate services. Please do not contact the website owner with unsolicited commercial offers.
Show More...