
Canada's Housing Recovery Is Coming — But Don't Expect a BoomWhat RBC's Latest Forecast Means for Buyers and Sellers in 2026-2027If you've been waiting for a sign that the Canadian housing

Dated: April 1 2026
Views: 1499
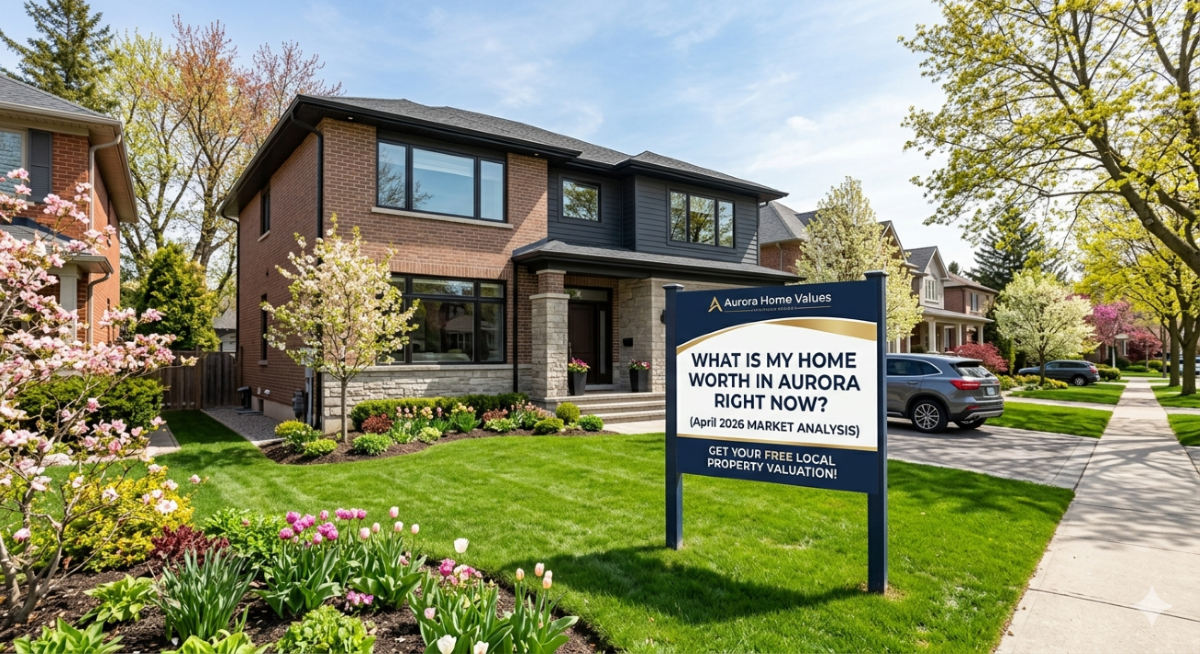
What is My Home Worth in Aurora Right Now? (April 2026 Market Analysis)
By Deepak Raj Realtor | April 1, 2026
If you're a homeowner in Aurora, Ontario, you've likely asked yourself this question as we move into the spring market: “What is my home worth in Aurora right now?”
With interest rates shifting, inventory tightening, and buyer demand picking up across York Region, understanding your property's true value is more critical than ever. As of April 2026, Aurora's real estate market is showing signs of balanced, sustainable growth—but the answer to that question is rarely a simple number.
This expert-level guide provides a data-backed analysis of the Aurora housing market, breaking down the trends, numbers, and neighborhood nuances you need to know.
As of April 2026, the average home price in Aurora sits at $1,340,000. This represents a 3.2% increase year-over-year and a 1.1% increase month-over-month, signaling a market that has stabilized and is beginning to appreciate after a period of rate-driven adjustments.
Compared with York Region's overall average of 1.22 million, Aurora continues to position itself as a premium suburban market driven by strong schools, transit access, and limited supply.
| Region | Average Price (Apr 2026) | YoY Change | Market Direction |
|---|---|---|---|
| Aurora | $1,340,000 | +3.2% | Balanced Growth |
| York Region | $1,290,000 | +2.5% | Stabilizing |
| GTA Total | $1,220,000 | +1.8% | Recovering |
In essence, Aurora's property values are holding firm thanks to a rebound in buyer confidence, declining interest rates, and ongoing population inflows.
Aurora forms part of Toronto's northern commuter belt yet maintains its distinct small-city character. Limited new-home supply and consistent employment in nearby tech and service hubs keep demand resilient.
| Property Type | Average Price | YoY Change | Sales-to-List Ratio | Avg. Days on Market |
|---|---|---|---|---|
| Detached | $1.58 M | +2.9% | 99% | 16 days |
| Semi-Detached | $1.12 M | +3.6% | 101% | 13 days |
| Townhouse | $965 K | +4.1% | 102% | 12 days |
| Condominium | $705 K | +2.2% | 100% | 18 days |
Bayview Wellington: – Popular for first-move-up buyers.
Aurora Heights: – Known for family-friendly detached homes.
Hills of St. Andrew: – Luxury estate area.
Aurora Grove / Bayview Northeast: – High turnover due to accessibility and schools.
Aurora Village: – Downtown character homes.
Summary Insight: Inventory remains about 30% lower than historical norms, keeping upward pressure on prices despite modest overall sales volumes.
Aurora's market in 2026 is shaped by a balance of economic momentum, rate relief, and regional migration. Key influences include:
Lower borrowing costs — Following the Bank of Canada's gradual rate reductions through late-2025, five-year fixed mortgage rates now hover near 4.3% , improving affordability.
Population and infrastructure growth — Steady inbound migration to York Region and GO Transit connectivity keep housing demand elevated.
Limited land supply — Aurora's mature zoning and greenbelt boundaries restrict new large-scale developments, tightening resale supply.
Quality-of-life fundamentals — Reputation for top-rated schools and active community life makes Aurora a "sticky" market.
Policy and economic stability — Stable employment levels and moderated inflation sustain household confidence.
Lower mortgage rates
Scarce inventory
Strong commuter accessibility
Ongoing population inflow
Limited new-construction pipeline
To understand Aurora's standing, it helps to compare performance with neighboring municipalities.
| City | Average Price | YoY Change | Market Condition |
|---|---|---|---|
| Aurora | $1.34 M | +3.2% | Balanced → Slight Seller's |
| Newmarket | $1.15 M | +4.0% | Balanced |
| Richmond Hill | $1.48 M | +1.9% | Seller's |
| King City | $1.97 M | +2.1% | Luxury Buyer Market |
Is Aurora currently a buyer's or seller's market?
Aurora leans slightly toward a seller's market due to low inventory and rising list-to-sale ratios averaging 101%.
What's the average price per square foot?
Detached homes average around $830/sq.ft. , while newer townhomes sit near $680/sq.ft.
Are prices expected to increase further?
Moderate growth (2-4%) is expected through mid-2026 if borrowing costs remain steady.
The phrase "What is my home worth?" depends on more than headline averages. Every Aurora property has its own market story.
Location: Immediate proximity to Bayview Ave., Yonge St., schools, and parks.
Lot Size & Exposure: Wider frontage and southern sun orientation can lift value 5-10%.
Condition & Renovations: Updated kitchens, roofs, or EV charging add tangible resale premiums.
Comparable Sales: One-month sales within 250m radius are most predictive.
A detached three-bedroom on Bayview Ave, 2,000 sq.ft., updated in 2022, on a 40x110 lot may be valued between $1.35M and $1.45M in April 2026—depending on finishes and proximity to transit.
Review local sold data via TRREB Market Watch or Ontario MLP resources.
Adjust for property-specific variables—lot, condition, year built.
Monitor interest-rate announcements from the Bank of Canada for short-term shifts.
Consult a local CMA (Comparative Market Analysis) with a Realtor who knows micro-neighborhood dynamics.
Validate against AI-based tools but refine results with human insight.
*Homeowners using both automated estimators and a professional CMA tend to price within 2-3% of true market value—versus 7-10% variance when relying on online estimates alone.*
Aurora homeowners today need more than rough valuation calculators—they require precision guided by data, technology, and local experience.
Deepak Raj Realtor leverages real-time TRREB sales feeds, town permit data, and AI-enhanced analytics to produce valuations that reflect immediate market sentiment rather than quarterly averages.
Automated models can identify price baselines but often miss micro-factors—street orientation, upcoming zoning changes, or buyer motivation. A Realtor grounded in the Aurora market context fine-tunes those insights into actionable pricing strategies.
Whether refining your list price or planning equity use for an upgrade, Deepak integrates:
Transparent CMA presentations with supporting TRREB data.
Proven negotiation strategies anchored in recent sale benchmarks.
Market-timing advice aligned with seasonal buyer patterns.
Personalized staging and marketing recommendations for higher perceived value.
As the 2026 market transitions into late spring, several macro trends will shape Aurora's trajectory:
Interest-rate environment: With the Bank of Canada expected to hold or trim an additional 25 bps by June 2026, demand should remain steady.
Inventory forecasts: Listings may rise modestly (5-7%), offering buyers more choice without diluting prices.
Immigration impact: Continued inflows sustaining York Region growth will underpin detached-home demand.
Construction pipeline: Limited new completions constrain supply, lending support to price stability.
Outlook Summary: Aurora home prices are projected to appreciate 2-3% through Q3 2026, particularly for mid-range detached and townhouse segments.
If you're upgrading locally: Yes. Equity levels are high, and stable rates enhance trade-up affordability.
If you're downsizing: Buyer activity in the 1.1M tier remains strong; selling now allows capture of top-quartile pricing.
If you're holding long-term: Expect moderate, sustainable appreciation rather than rapid spikes.
As of April 2026, Aurora's housing market illustrates balanced, sustainable growth underpinned by affordability recovery and enduring community demand. For homeowners asking "What is my home worth in Aurora right now?", the answer is best framed as:
Your home's worth equals today's market data + micro-location + condition + expert interpretation.
Working with Deepak Raj Realtor means interpreting those moving parts with precision—combining objective analytics, AI tools, and local expertise to reveal your property's true position in one of York Region's most resilient markets.
Ready to find out what your Aurora home is truly worth in today's market? Don't rely on generic algorithms. Get a personalized, data-driven Comparative Market Analysis (CMA) from Deepak Raj Realtor.
Contact us today:
Phone: 705-668-0297
Email: Primehomesto@gmail.com
Website: https://www.primehomes.ca/
Serving Your Community:
Mississauga: Unit 1 - 2896 Slough St, L4T 1G3 (Serving Peel Region & West GTA)
Markham: Suite 206 - 3 Centre St, L3P 3P9 (Serving York Region, Durham Region & North/East GTA)
Kitchener: Suite 2B - 625 King St E, N2G 2M2 (Serving Waterloo Region)
Hamilton: Suite 300 - 163 Centennial Pkwy N, L8E 1H8 (Serving Hamilton-Burlington Area)
Sources: TRREB Market Watch (Apr 2026); Bank of Canada Interest Rate Statistics; CMHC Housing Observation Reports; Ontario MLP Market Stats.

Deepak Raj, REALTOR® | Royal Canadian RealtyServing Newmarket, Aurora, Stouffville, East Gwillimbury and York RegionCall or text: 705-668-0297 | Primehomes.ca📅 Book a Free Consultation....
Canada's Housing Recovery Is Coming — But Don't Expect a BoomWhat RBC's Latest Forecast Means for Buyers and Sellers in 2026-2027If you've been waiting for a sign that the Canadian housing
GTA & York Region Real Estate Market Update: August 2026What the latest TRREB numbers mean in Newmarket, Aurora, Markham, Vaughan, Simcoe County and across Southern OntarioBy Deepak Raj, Realtor
Newmarket Market Data · July 2026How Long Does It Really Take to Sell a House in Newmarket?2026 Market Data, Neighbourhood-Level Days on Market & What It Means for Your SaleQuick AnswerAs
Deepak Raj Realtor Royal Canadian Realty, BrokerageBook a Free ConsultationUnderstanding your Buyer Representation Agreement before you sign matters as much as the offer itself.Ontario Buyer's&

The listing data displayed is deemed reliable but is not guaranteed accurate by CREA®. Data last updated on September 22, 2026 5:42 PM UTC The trademarks REALTOR®, REALTORS®; and the REALTOR® logo are controlled by The Canadian Real Estate Association (CREA®) and identify real estate professionals who are members of CREA®. Used under license. The trademarks MLS®, Multiple Listing Service® and the associated logos are owned by The Canadian Real Estate Association (CREA®) and identify the quality of services provided by real estate professionals who are members of CREA®. Used under license.
Show More...
 Data provided by the Ontario Regional Technology & Information Systems. The information is deemed reliable, but is not guaranteed. Not intended to solicit buyers or sellers, landlords or tenants currently under contract.
The trademarks REALTOR®, REALTORS® and the REALTOR® logo are controlled by The Canadian Real Estate Association (CREA) and identify real estate professionals who are members of CREA. The trademarks MLS®, Multiple Listing Service® and the associated logos are owned
by CREA and identify the quality of services provided by real estate professionals who are members of CREA. Used under license.
REALTOR® contact information provided to facilitate inquiries from consumers interested in Real Estate services. Please do not contact the website owner with unsolicited commercial offers.
Show More...
Data provided by the Ontario Regional Technology & Information Systems. The information is deemed reliable, but is not guaranteed. Not intended to solicit buyers or sellers, landlords or tenants currently under contract.
The trademarks REALTOR®, REALTORS® and the REALTOR® logo are controlled by The Canadian Real Estate Association (CREA) and identify real estate professionals who are members of CREA. The trademarks MLS®, Multiple Listing Service® and the associated logos are owned
by CREA and identify the quality of services provided by real estate professionals who are members of CREA. Used under license.
REALTOR® contact information provided to facilitate inquiries from consumers interested in Real Estate services. Please do not contact the website owner with unsolicited commercial offers.
Show More...